- Uncharted Area
- Posts
- Viz Extensions - Tableau's Biggest Revolution
Viz Extensions - Tableau's Biggest Revolution
Y más contenido si hablas español
Tristan Guillevin
February 09, 2024
¡Hola!
This month, we are sending our emails from Mexico 🇲🇽
That’s why you receive this email at a different time than usual; the newsletter is jetlagged; it’s not at all that I was busy eating tacos 👀
Today, I want to share the early stage of our upcoming project around Viz Extensions. I believe this will be one of the most significant changes in Tableau since I started using it in 2015!
We also had the chance and honor to present at the Online Comunidatos event (the first time Jessica and I are doing a presentation together, and in Spanish!) and at the first Tableau User Group in Mexico City. Below, you can find the recording of our talk!
But first, let’s answer the hot take of the week.
Is Tableau dead?
Since I started this newsletter and my company, I aimed to create tools to fix Tableau’s most common issues, mostly because I saw no signs that Tableau would fix them anytime soon.
We created BANg to generate KPIs automatically (goodbye annoying and complex date calculations), a Figma Plugin to not have to deal with containers, and AdvViz to create complex charts easily and without templates.
Recently, Tableau focused more on integrating with Salesforce and adding shiny AI features instead of fixing long-term user requests.
Everyone noticed it.
This is your quarterly reminder that Tableau is dead and to look for the next tech to replace it.
— Shaun Davis (@shaunisspatial)
Feb 6, 2024
So is Tableau going to “die,” or is it already dead?
I think not; quite the opposite. Actually, I have never been more enthusiastic about using Tableau than in the last few weeks.
Let me share with you why.
Power to the Devs
Since I started using tools other than Tableau, and especially d3.js, to create my first network chart, I had one dream: combine Tableau's ease of handling data (to connect, refresh, filter, and interact) and the power of d3.js create and design any charts.
This will be a reality very soon.
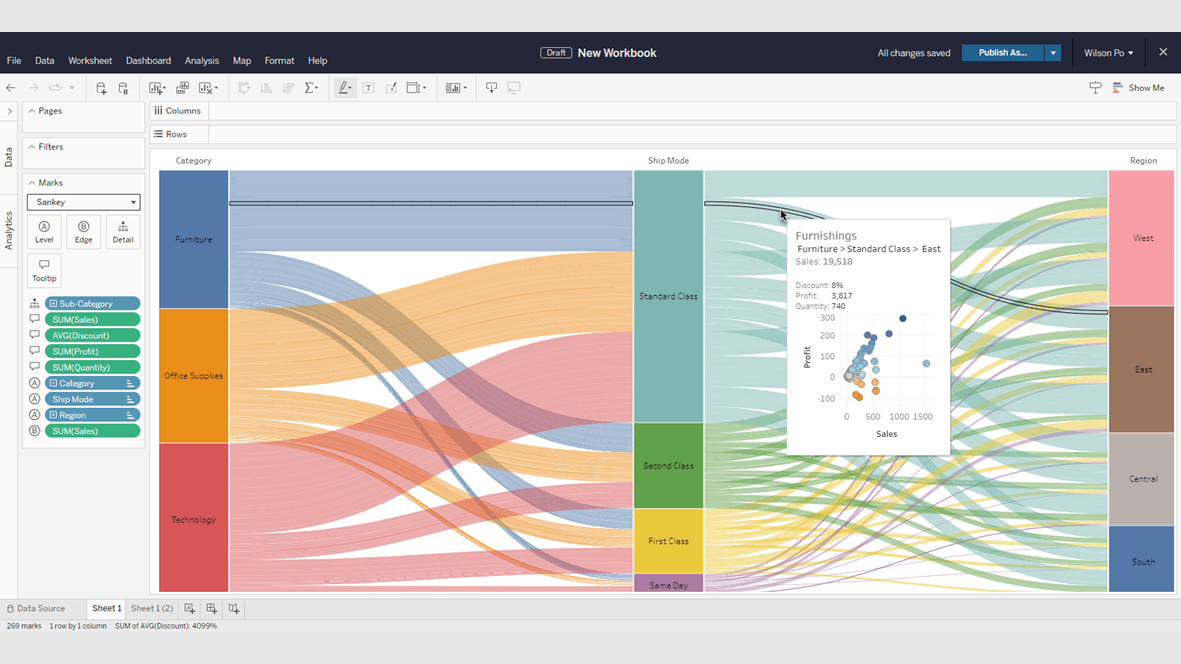
A few months ago, you had the opportunity to create a Sankey directly in Tableau without templates or any tricks, simply by using a native Sankey Mark that looked and left like any other Tableau Mark.
Well, imagine that, but for any charts you can imagine and with no limit in terms of personalization: Viz Extensions.
This upcoming new feature is exactly what we were waiting for and will solve the number one request we receive: use our advanced charts directly in Tableau, connected to the data.
Rounded bar chart? Curved line chart? Native chord diagram? Interactive Network? Yes to all of that, with all the refresh, filter, and actions you love.
And the best part is that we don’t have to wait for Tableau developers to build the charts. Viz Extensions allows developers to create and share the new viz type with everyone.
So, if you always wanted to create a Network chart in Tableau with just two drag and drop, check this out.
Viz Extensions in Action
All the advanced visualizations available today in AdvViz will be available as Viz Extensions at launch.
Want to make a Beeswarm? Sure, select the Beeswarm Marks, drag and drop your dimension, your X-axis field, maybe a field for the colors, and voilà!

The best part? Everything looks and feels like Tableau: the tooltip, the hover-over, and the Exclude button... It IS Tableau.
What about a Voronoi Treemap? Same! You can split and group your Voronois, change the shape, modify the tooltip, and use it as any other visualization in Tableau!

Finally, just as you’d expect, you can create filter actions between the different worksheets and create interactive experiences with complex visualizations without any hacks.

As you can imagine, I am more than excited about this new feature, and I want to thank Wilson Po and Jacquelyn Cheng (and all the developers behind it) for making this possible.
More than just advanced charts, this can allow everyone to create a custom charts library that always respects the company design system and with any type of interactions on click or hover.
We want to make sure to continue to create good content for you, so we made this poll for us to know if this is a subject that interests you.
Are you interested in learning more about Viz Extensions? |
If you are interested in Viz Extensions (and understand Spanish), we have one more thing to share!
ComuniDatos #DataDev
We were very lucky to share our talk “Building Bridges” in Spanish during two ComuniDatos events!
The first was an online event where we shared the stage with Cristian Saavedra, who showcased Viz Extensions.
The event was recorded, and you can watch the replay here:
Thanks to all the organizers; it was a great event and my first talk in Spanish 😱 so thank you for your trust!
One week later, we were in Mexico City to give the same talk live! Thanks a lot to Jonathan Gamino for organizing this event in such a short time!
Check out the ComuniDatos page for future events online or near you!
Next week, I’ll be back with a new YouTube video! It’s already recorded; I just need to finish editing it.
🌮
That’s it for this week!
You can reach us easily over there:
‣ Website: https://www.ladataviz.com
‣ Twitter/X : https://twitter.com/ladataviz
‣ Youtube: https://www.youtube.com/@ladataviz
‣ LinkedIn: https://www.linkedin.com/in/ladataviz/
‣ All other links: https://linktr.ee/ladataviz
If you have any suggestions, feedback is appreciated!