- Uncharted Area
- Posts
- Exciting Insights from Berlin 🌟
Exciting Insights from Berlin 🌟
Mega Dashboards and Big Little Tips
Tristan Guillevin & Jessica Bautista
November 30, 2023
Hallo 👋
We greet you in the proper German way as a nod to our recent adventure in Germany's capital!
Last week, we released our new Figma to Tableau Plugin and received great feedback; thanks! We are already busy implementing some feedback (Navigation button, multiple dashboards), and we’ll tell you more next week!
Check last week’s email in case you missed it 👉 https://newsletter.ladataviz.com/p/figma-to-tableau-plugin
This week, we want to share what we learned from VizItBerlin. This is one of the biggest community-led Tableau events of the year, and we had a blast 💥. Huge thanks to the organizer; the logistics and the organization were impeccable! But there were also great speakers and incredible networking opportunities.

We didn’t take any pictures, so thank you, Victor, for this one!
Sadly, not everyone could attend (yes, German weather in November can be scary), and the talks were not recorded, but don’t worry! We are here to bring you some of our highlights ⭐️
We selected two topics, one inspirational and one technical, that we think would be helpful for you!
📈Mega Dashboards: Everything Everywhere All at Once
One of the talks we attended was from The Information Lab Deutschland’s consultant, Nico Hopp, regarding Mega Dashboards.
Have you ever encountered a client or colleague who wants ALL their available information on one dashboard? It's a scenario we have all faced once (or, sadly, quite frequently), and it's daunting! 😮💨

Nico explained that the desire for mega dashboards often stems from businesses and users being unclear about what information is crucial. This makes them fall prey to FOMO - the fear of missing out.
Flooding a dashboard with all available data will obscure the discovery and visibility of vital insights. All of that, without even mentioning the performance limitations!

As Data Analysts, our role is to, in Nico’s words, TALK TO THEM! We should guide and convince stakeholders that Mega Dashboards are not, in most cases, the ideal solution. We must highlight that the issue is not the quantity of information but the precision and focus on the business strategy.
The best way to achieve better dashboards is by asking better questions. More than “What chart do you want?” or “Which KPI do you want to track?”, we should ask:
“Who is the audience for this dashboard?”
“When is someone going to open the dashboard?”
“What questions does the dashboard need to answer?”
“What actions do you expect people to take after using the dashboard?”
Often, you can break down one mega-dashboard into multiple, more targeted, and much more efficient smaller ones.
🌎 #BigLittleTips
Another notable presentation at VizItBerlin was #BigLittleTips Live, led by Ivett Kovács from Grayscale Studio and Ludovic Tavernier from Ledger.
BigLittleTips is a fantastic weekly series that provides practical Tableau tips and advice based on the experts' daily experience. The best part about these insightful tips is that they are free of charge and can help you save work hours and avoid frustration.
You can find most of their tips here 👇

Even after eight years of Tableau experience, this session taught us a few tricks! Here is one that we will use in our next projects.
Use Unicode to personalize your visualization.

For example, this parameter uses Braille Patterns and Box Drawings:

As you can see, using Unicode can significantly enhance the quality of your Tableau dashboards. This was not a new tip, but Ivett shared this website that is a gold mine and great unicode ready to be used.
For more great tips, follow them on Twitter/X at @IvettAlexa and @ltavernier7.
📣 A Call to the European Tableau Community
One of the sessions was “Ask us anything.” from Tableau’s leadership, and the very first question (that everyone wanted to ask) was: “Where is Tableau Conference Europe?!”
The Tableau Conference is the largest and most attended Tableau event. However, many users are based outside of the US, and this is an opportunity to create something closer to home. Bringing this project to life has proven challenging without a clear view of what the community wants and needs.

The Tableau community has spoken: We 👏 Want 👏 TC 👏 Europe. To help tackle the challenge of what this event should be, Sarah Bartlett (@sarahlovesdata) has initiated a survey to help gather insights into what the community would like to see as TC Europe.
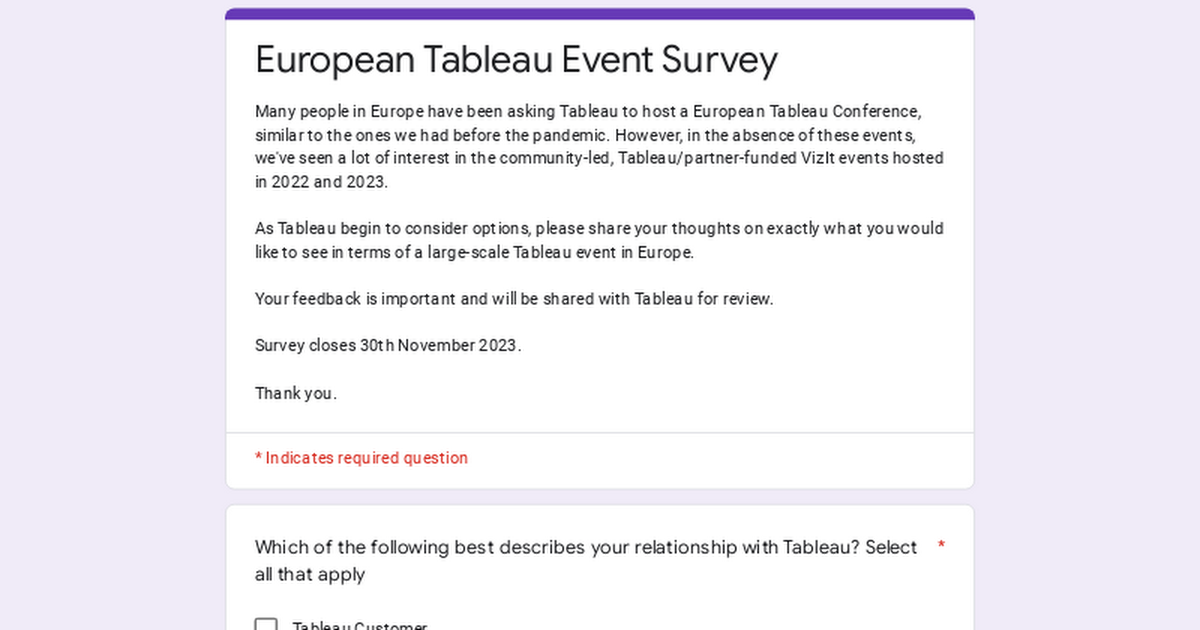
This is our chance to express our opinion—the more feedback they get, the greater the chance Tableau can cater an event for us. Your participation in this survey will help shape what kind of events will be possible 🙂
Let's make our voices heard! 📢
That’s it for this week!
You can reach us easily over there:
‣ Website: https://www.ladataviz.com
‣ Twitter/X : https://twitter.com/ladataviz
‣ Youtube: https://www.youtube.com/@ladataviz
‣ LinkedIn: https://www.linkedin.com/in/ladataviz/
‣ All other links: https://linktr.ee/ladataviz
If you have any suggestions, feedback is appreciated!