- Uncharted Area
- Posts
- Chord Diagram and Q2 Plan
Chord Diagram and Q2 Plan
New Chord Diagram generator and what to expect next quarter!
Hi 👋
The first quarter of 2023 is already over 😲
In this newsletter, you'll get the usual update on the tool, and I'll also review my Q1 goals and set the new ones for Q2!
For the French-speaking people reading this: we are launching a new Tableau User Group, Le French TUG. The first event is on the 13th of April, and you can register here.
Advviz (Advanced Visualization Generator) Update
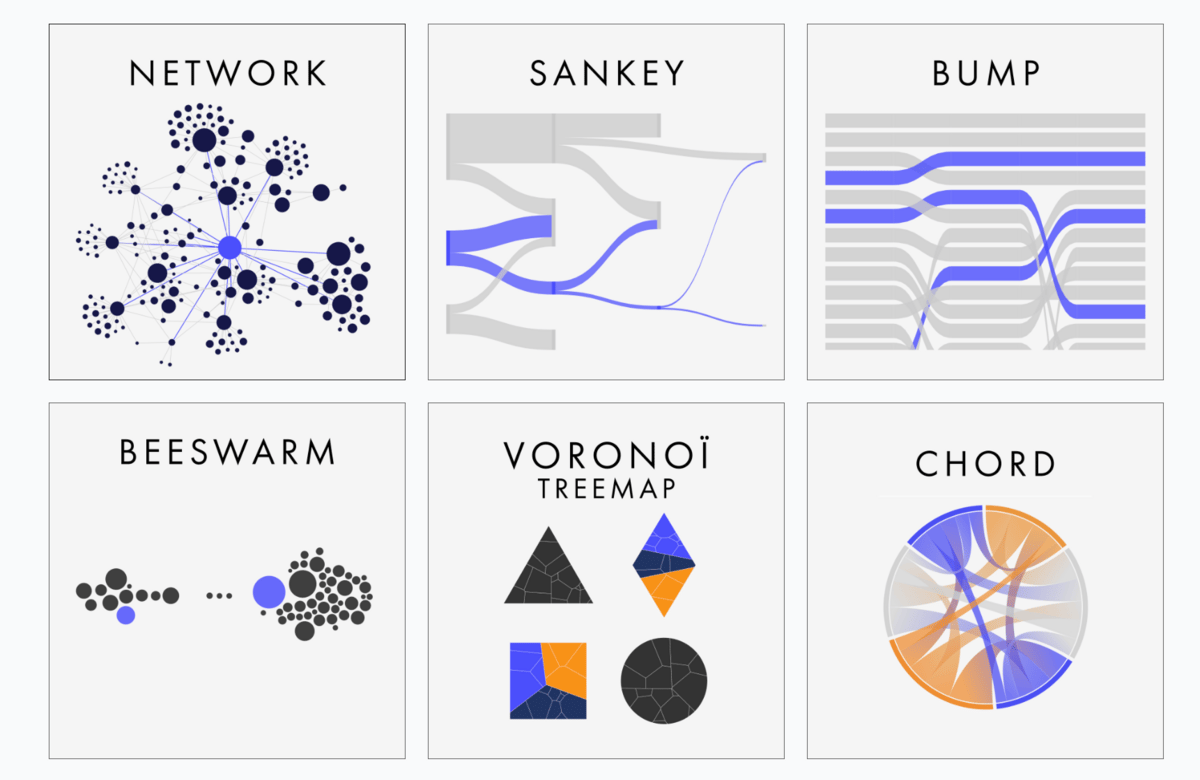
👉 You can now generate a Chord diagram ❃.This was a challenging generator to create! Mainly because, in almost all examples, the data is structured as a matrix. I want my generators to be as easy to use as possible, so on top of the visualization part, I also had to ensure the data could be input as a list of sources and targets.

Here are the other two minor updates:- the tool now has an official name: "Advviz" (for Advanced Visualization Generator)- bug correction for the Bump Chart generator
Youtube Channel
I try to post a least one video per month on my channel. Currently, I'm focusing on creating tutorials on how to use Advviz.

In my new video, I show you how to use the Bump Chart generator and create the evolution of the Top 15 Sub-Categories of Sample Superstore!
Q1 Goals
This year, I focus on sharing. My Q1 goals reflect this, and I'll continue this path in Q2.
Before revealing the Q2 plan, here's how I performed on my goals in Q1:- six generators at the end of the Q1 ✅- six videos on my youtube channel ❌ (I underestimated the time it takes) - one newsletter per month ✅
So far, I am happy with those results. I am happy to see how many of you have used the generators! I hope to reduce the time making new videos to have more Youtube content.
What to expect in Q2
The main challenge of Q2 will be time. I'll only have two months to work as May is entirely off (two data visualization conferences followed by three weeks of holidays).
On top of that, I'll present at the first edition of the French TUG and the Tableau Conference. I'll need some time to create the presentations, but this fits my yearly focus on sharing!
With that in mind, here are my goals for Q2:- release a new tool to generate KPIs: I have already started working on this and expect to release it in June. The presentation will be at the Tableau Conference with, maybe, a beta version available. You'll be the first to know! - create a gallery for Advviz: I want to showcase your work and the beautiful ways you have used the generator - create a video for each generator: this means three new videos on my Youtube channel
See you at the end of April!
Meanwhile, you can find me here:‣ Website: https://www.ladataviz.com‣ Twitter: https://twitter.com/ladataviz‣ Youtube: https://www.youtube.com/@ladataviz‣ LinkedIn: https://www.linkedin.com/in/ladataviz/‣ All other links: https://linktr.ee/ladataviz
If you have any suggestions, feedback is appreciated!